One of the big challenges when trading chart patterns is the tendency to have ambiguous rules for what qualifies as a pattern. It would be nice if we could sit here and tell you, “a double top pattern always takes four weeks to develop, it has a 3% retracement between point A and point B, and it will break down below the neckline within three trading sessions. That would be incredible, but unfortunately it wouldn’t be reality.
In the real-world, chart patterns are not that specific. Very little in trading is that specific. Even analysis disciplines that are heavily targeted towards binary thinking, such as Elliott Wave analysis, even those disciplines are not absolute in the rules.
So how do we approach trading to create more certainty?
- Know the basics of the rules
- Learn to identify the breakout signals
- Learn to be flexible
- Learn to be comfortable with close enough
- Learn to recognize the right time frame
Time Frame
When a new student is learning to trade with chart patterns, it almost seems as though they expect a pattern always to be forming. This leads to a situation where the trader is trying to force a pattern to appear when in reality there may not be a pattern at all. Once a person starts trying to force the appearance of a pattern, they tend to throw all of the other analytical reasoning out the window.
One of the best techniques you can use to zero in on whether or not you are getting the right pattern is to recognize the appropriate time frame. When you recognize patterns and they fit within an appropriate time frame, things start to come in line, and everything works better.
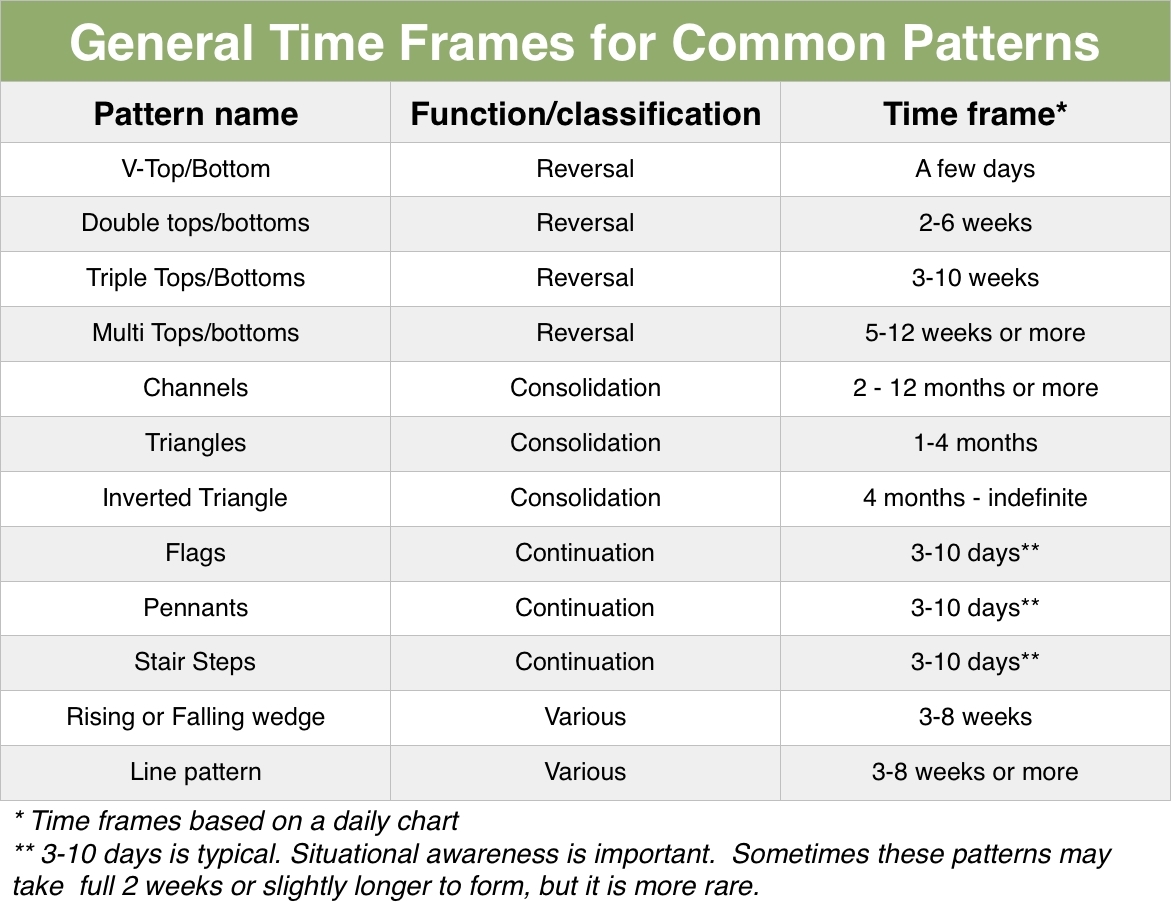
As a general rule, each of the three pattern classifications typically have similar time frames:
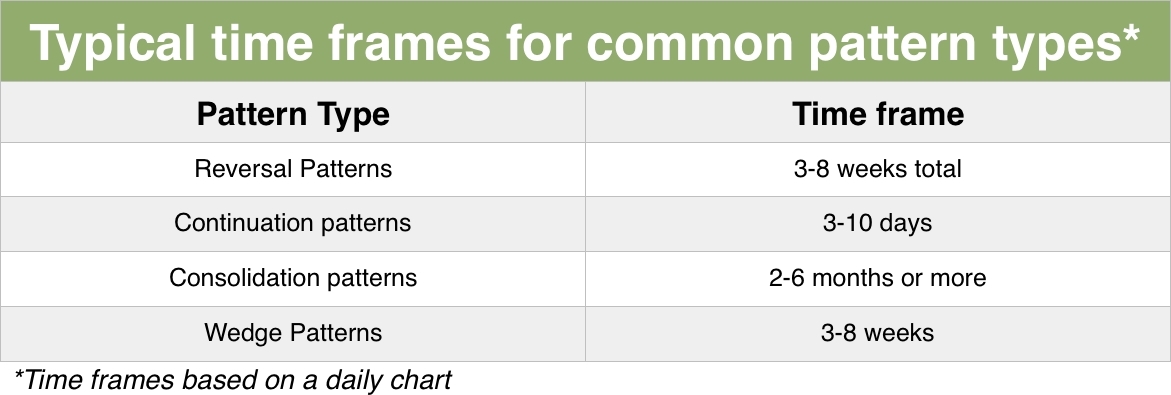
As you can see, reversal patterns typically take a few weeks, continuation patterns typically are a few days, and consolidation patterns are typically a few months.
Fastest way to memorize chart patterns, extremely simple to start and understand. Download Now!
As an example, let’s look at a double top pattern:
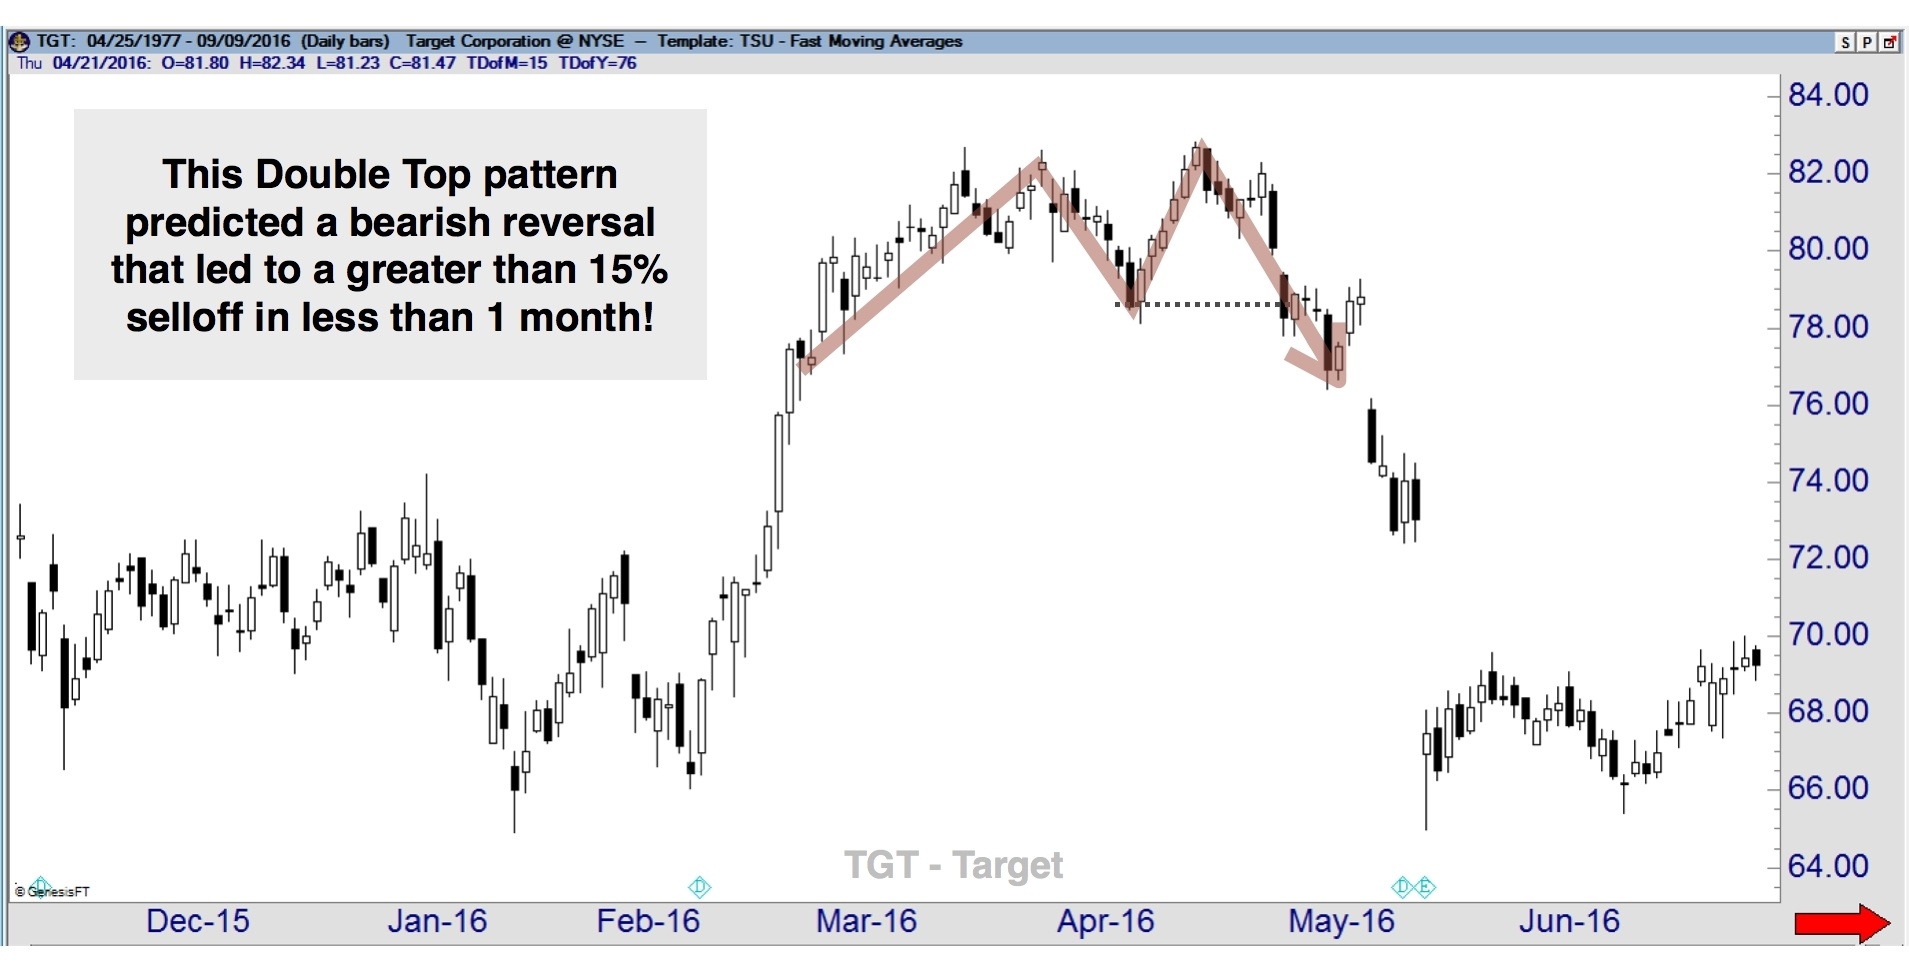
Above, you see an example of a textbook double top pattern. This pattern is at the top of a trend; it’s about 3-5 weeks in spacing between the peaks, the retracement between the peaks is not too large - this thing is ideal. Now let’s look at some less than ideal double tops.
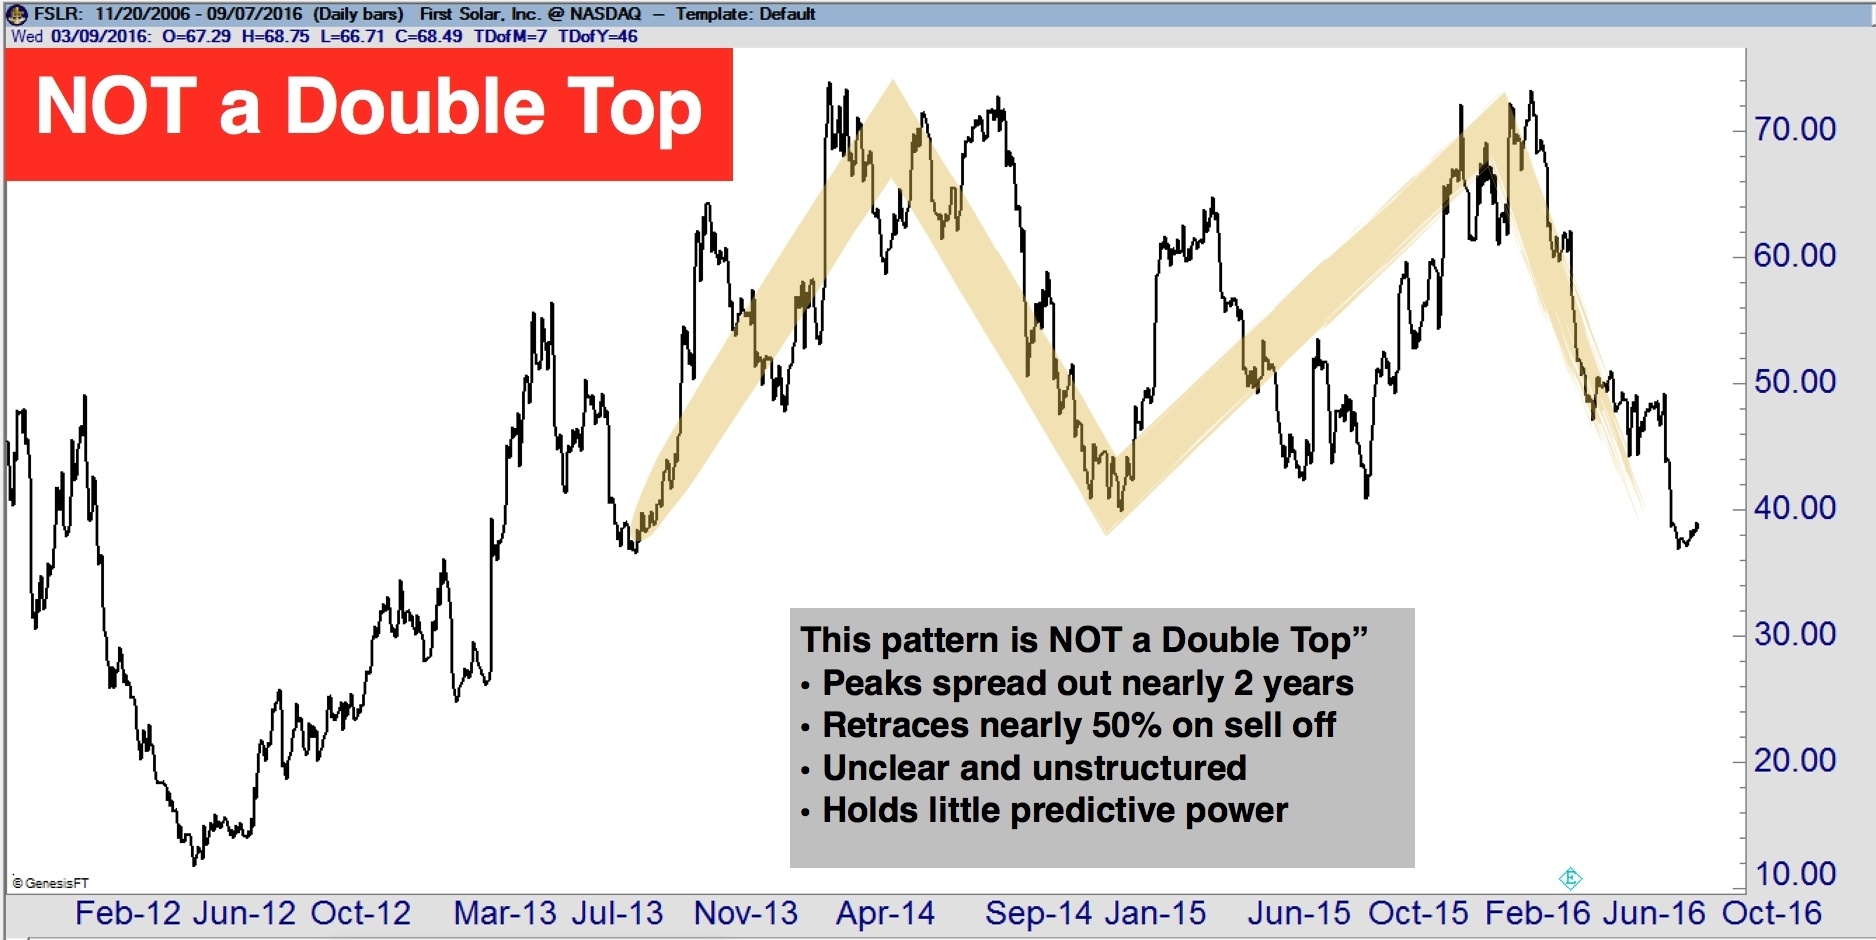
In this example is a perfect example of what is not a double top. First, the retracement between the two peaks is nearly 50% and secondly, the time between the two peaks is about two years. If someone identifies this as a double top it should not remain a mystery why the stock doesn’t trade as though it’s a double top as two years between peaks is just simply too long.
Here’s another extreme:
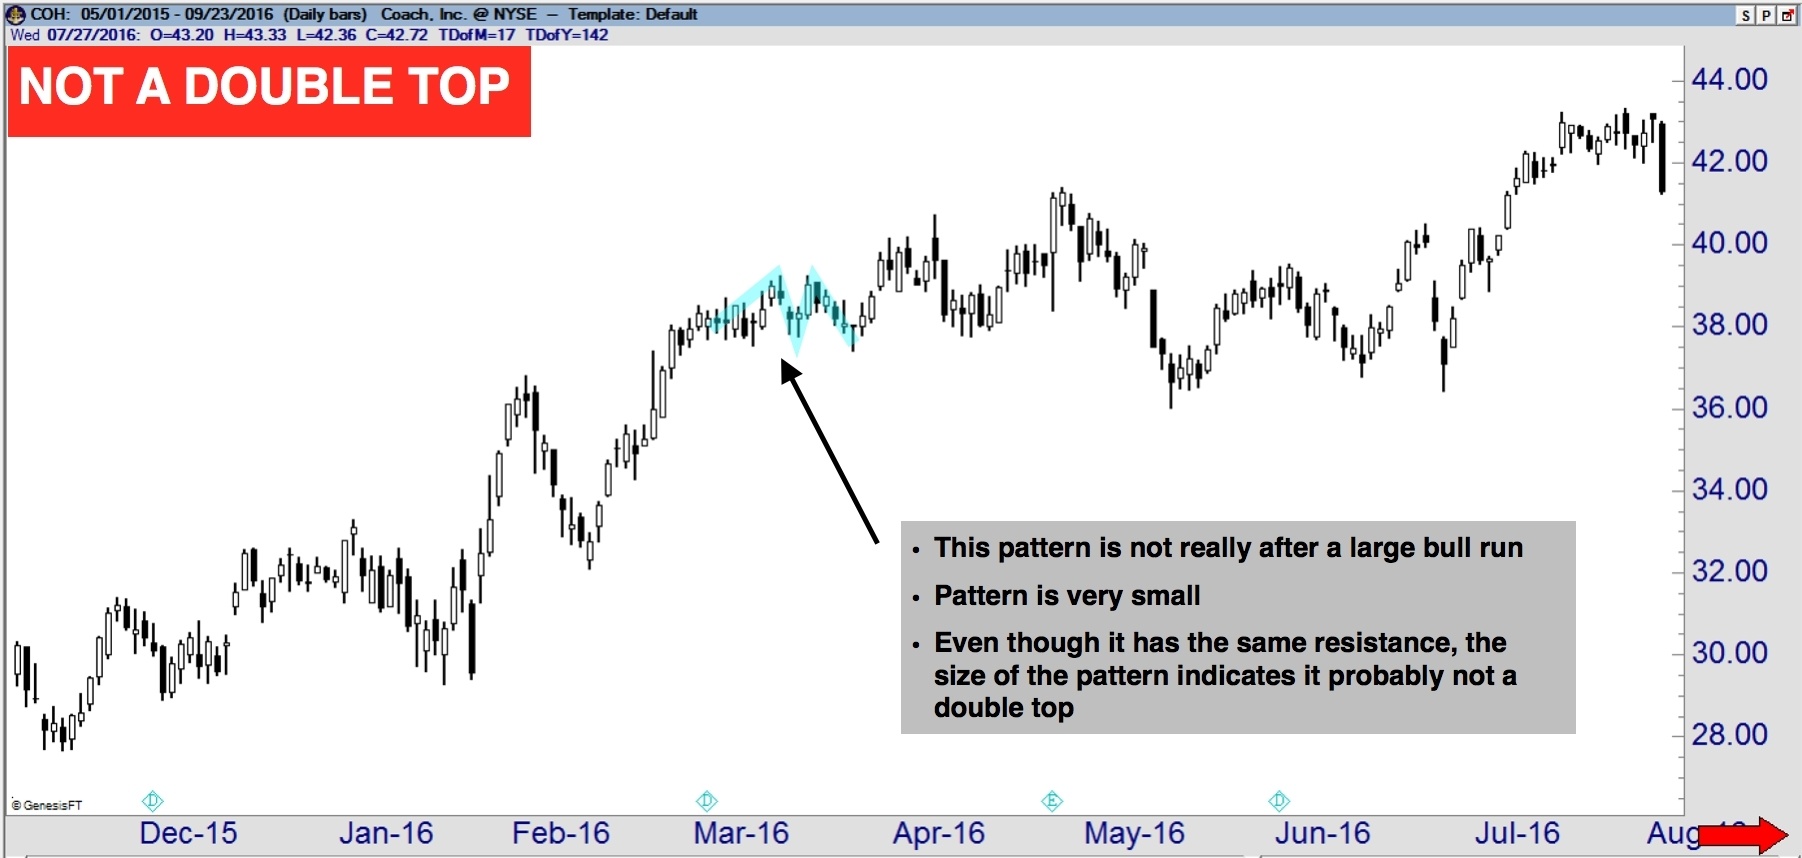
Here we have a stock that did hit the same general resistance area twice, but then it continued bullish. There are two challenges with this particular pattern. First, it is in the wrong spot as a double top happen at the top of trends, not in the middle. Secondly, it is tiny. A double top is a terminal pattern that terminates the previous trend, which means at best this is a small minor level series of moves that is nothing more than a blip in the overall movement of this trend.
These two examples are extremes, but they show a good contrast between what a trader should be looking for and should not. More importantly, they show how differently the correct pattern looks and demonstrate how it becomes obvious which one is correct once you look at some that are not.
Chart Patterns: What Time Frame Should They Be?
As a general rule, the following is a reasonable guide to the time frame of some of the most popular patterns.
What About Day Trading?
Everything we have laid out above is relevant to trading on a daily chart. So how do things change when someone is trading a weekly chart or a 5-minute chart? Here’s the cliff’s notes version of application to intra-day time frames: learn to identify patterns on a daily chart, and then apply that visual to an intra-day chart. It’s that simple. Chart patterns are visual. Once you learn to identify them on a daily chart, applying them to an intra-day chart is simple.
Look at the Following Two Charts.
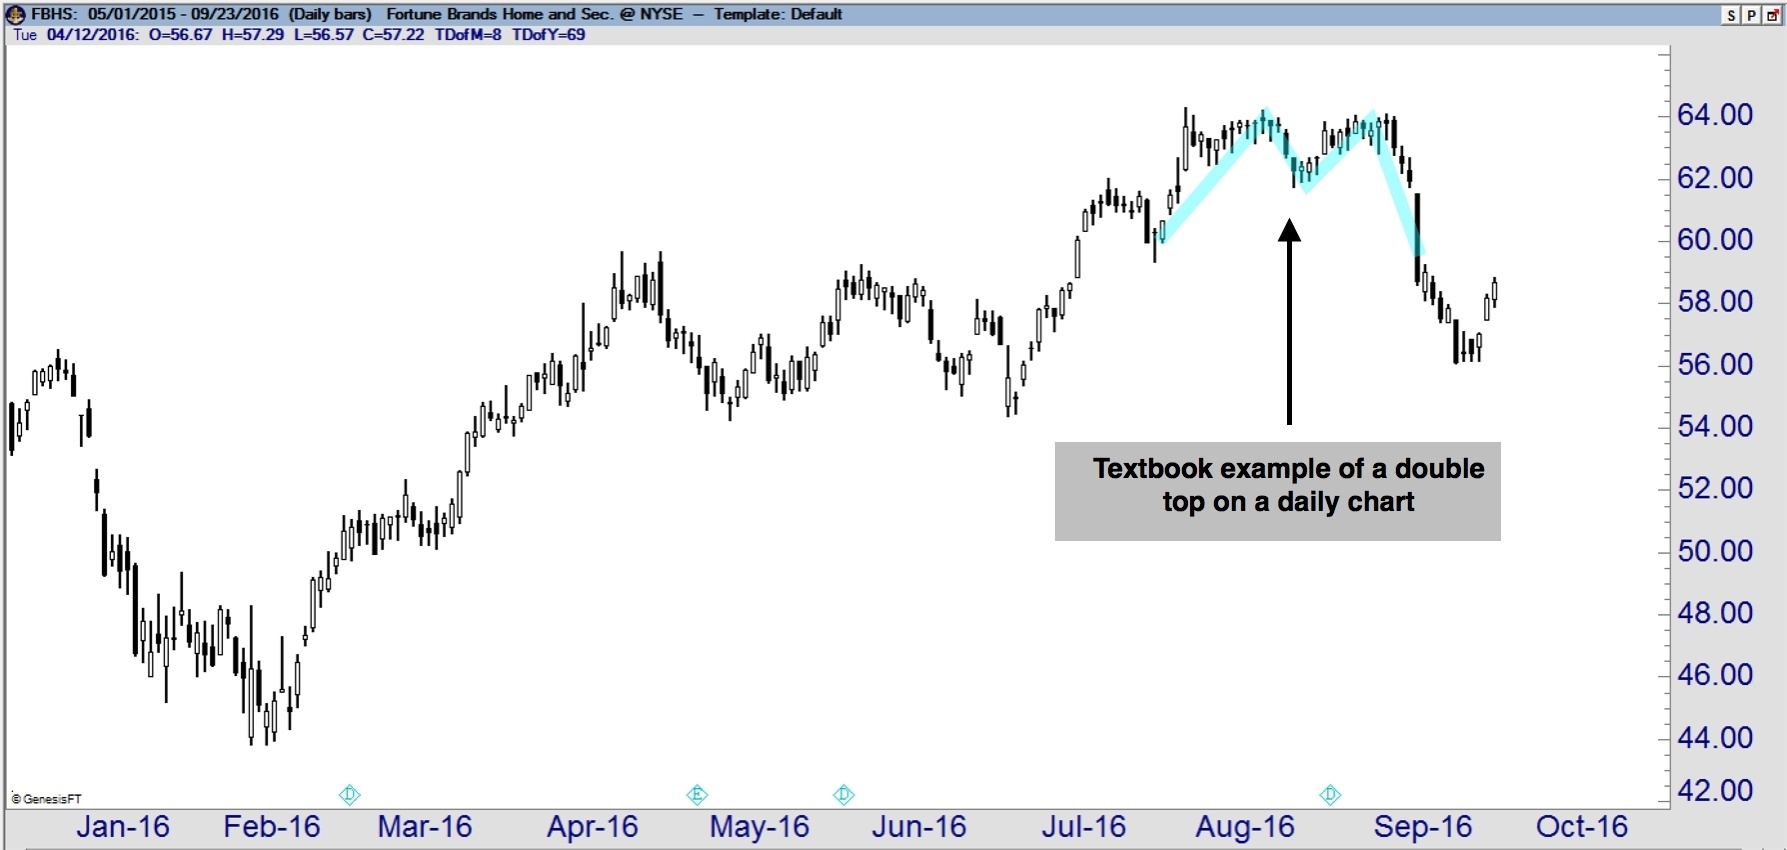
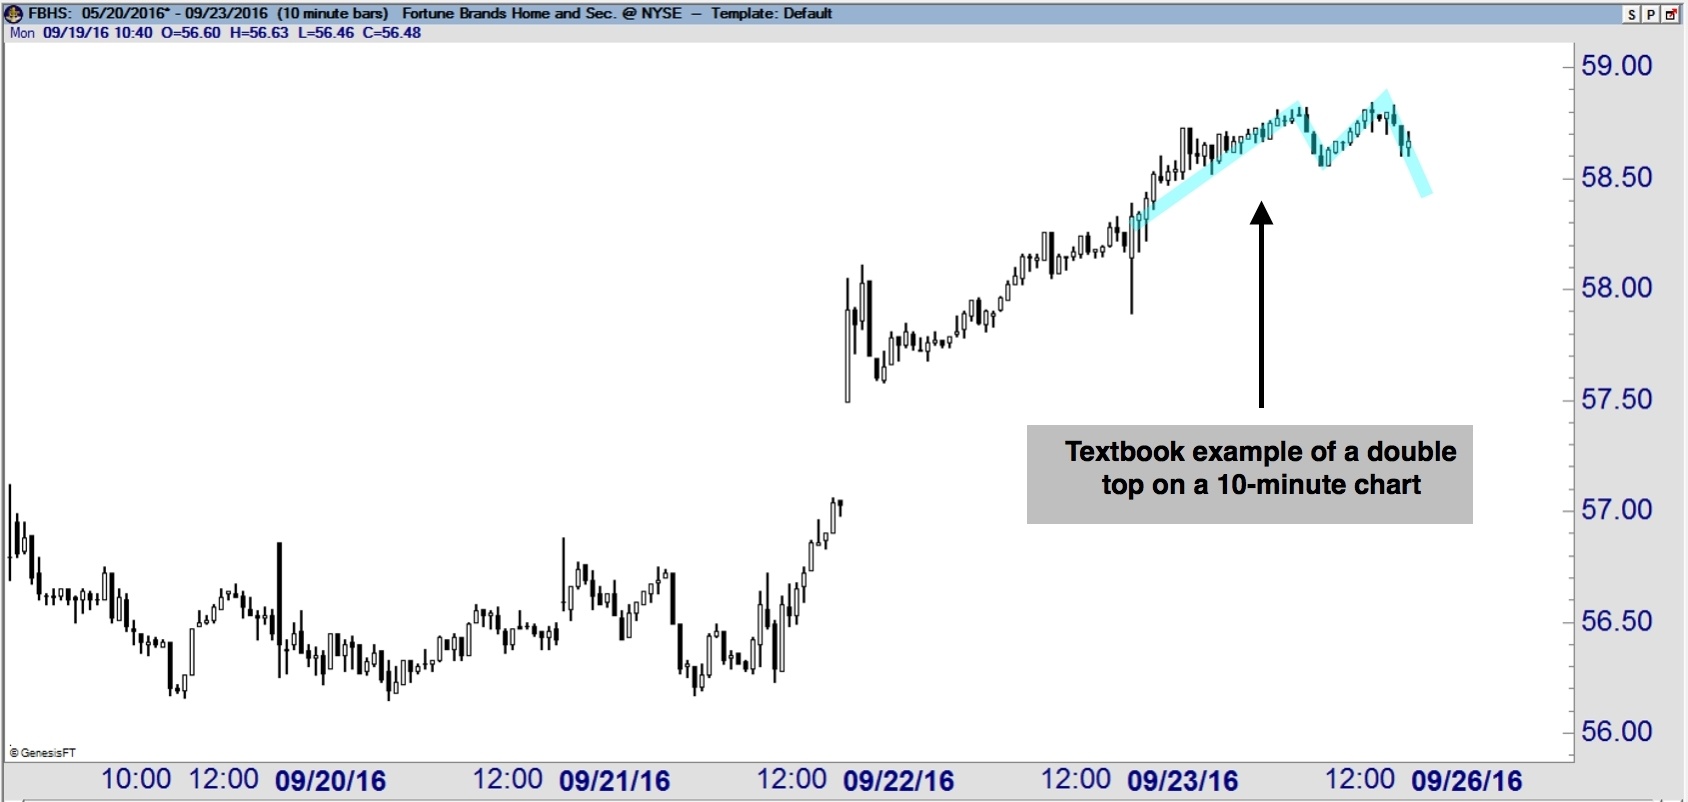
Despite the fact these two charts are different time frames, the chart pattern looks the same. The top chart is a double top on a daily chart, and the bottom chart is a double top on a 10-minute chart. So if you are a day trader, have no fear; the work you apply to learning chart patterns will translate exactly the same to your day trading charts.
Like most analysis tools, chart patterns are a great addition to the technical trader, but only when you apply them properly. Not recognizing the appropriate time frames can be a real killer to doing good chart pattern analysis. If you stick with the general guidelines above, you will see much better results with your chart pattern analysis.
