Around the world of would-be stock traders, one central question seems to be common:
Which stock is about to go up?
When I meet someone, this is their first question, after they find out what I do. However, I always meet their question with the same response: "You're asking the wrong question!"
It is understandable why so many people want to know "which stock should I buy" or "which stock is about to go up." It feeds into our natural human nature to get a hot tip that will profit us. It also plays into the widespread dogma that "up is good" and "down is bad." It also plays into our natural human desire to not have to make a decision that could be costly if you take someone else's advice, and it doesn't work; it's not your fault!
A better question would be, "How do I trade with confidence?" You tell me, which would you rather know the answer to? Would you rather have a "hot stock tip" or have a knowledge base that allows you to consistently "trade with confidence"?
At TradeSmart, we believe it is better to learn how to trade confidently than always to be chasing "hot stock tips." The reality is that hot stock tips may or may not be hot. Moreover, how do you know you should buy them if they are hot? And if they are great, how do you know how to repeat your luck?
All of our classes at TradeSmart University are intended to give you, the student, more knowledge so that you can trade with better confidence. Our process in almost every trade analysis is at the core of our analysis.
5 Steps to Trade Confirmation
The fastest way to build confidence in your trades is to learn to do good trade analysis. A good analysis will give you confidence in choosing the direction up or down of the trade, which you can apply by choosing the appropriate strategy. As technical traders, there are five steps we work through to help us confirm a trade setup. Based on the analysis we get from each step, we can make a highly educated analysis of the next likely direction for this stock to move, up, down, or sideways.
Here's the best part: This process works the same if you're a Day Trader, Swing Trader, or even a Long Term trader. And maybe the best part is, when you learn to do this process well, you can take any stock (even if you've never heard of it) and analyze the trade in about 10 minutes or less. So what is this process of confirmation?
Step 1: Determine the Framework of the Trade
Despite the widespread rumors that "Wall Street is just random," the stock market is surprisingly structured. Savvy traders have discovered a framework that most stocks tend to trade within. More than 100 years ago, Charles Dow referred to the traders who understood this as "the informed traders," while the rest of the market participants were considered "the uninformed." The informed traders know where the stock should be trading and where it should not be trading. When the stock gets to a price range where it should not be trading, the informed trader takes a trade to exploit that weakness.
There are many tools we can use to identify this grid. Many tools such as Fibonacci analysis or Pivot Point Calculators can estimate within reason where the next turning point on the grid should be. Despite the advanced tools, one of the most basic and effective ways to identify the grid is to draw it with old-fashioned support and resistance lines.
Support & resistance lines help provide a framework for the stock you're trading by identifying where the buyers and sellers tend to appear based on historical trading behavior. You draw a line where the buying behavior is and another line where the selling shows up. We call this support, buying at support, or resistance, selling at resistance.
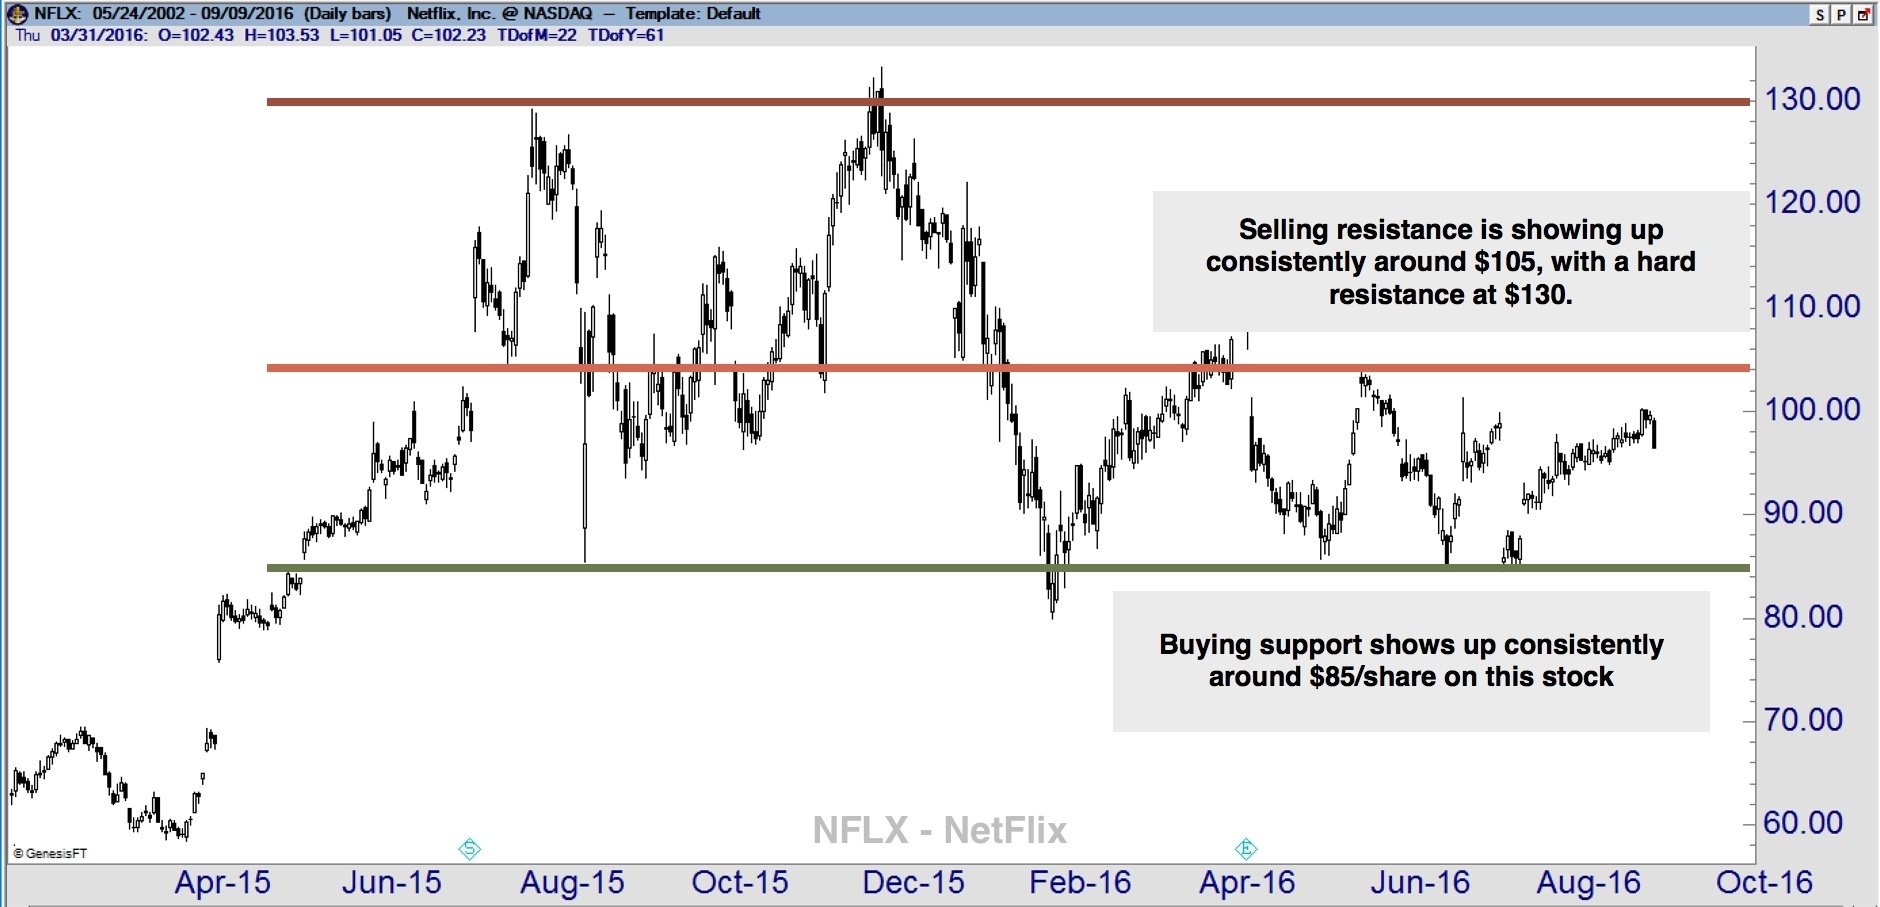
Support & resistance is easy to learn and a very effective way to identify where a stock should or should not be trading. But Identifying the framework only tells us one thing - the general structure of the trade. To know if we should make the trade, a trader must do the next step.
Step 2: Determine the Stock Trend
The trend is everything. To trade effectively, a trader must determine the direction of the trend. Is the stock trending up, down, or sideways? I am amazed by how many students I have that know every part of their analysis, yet they continue to ignore the apparent trend and try to trade against it. The old saying on Wall Street is:
The trend is your friend.
There's a reason this is an old saying on Wall Street because it's true! If you want to trade with confidence, trade with the trend. Trend identification can be straightforward. The simplest tool we use is the Moving Average indicator. This tool will help you identify if you're in a trend and in which direction the trend is going.
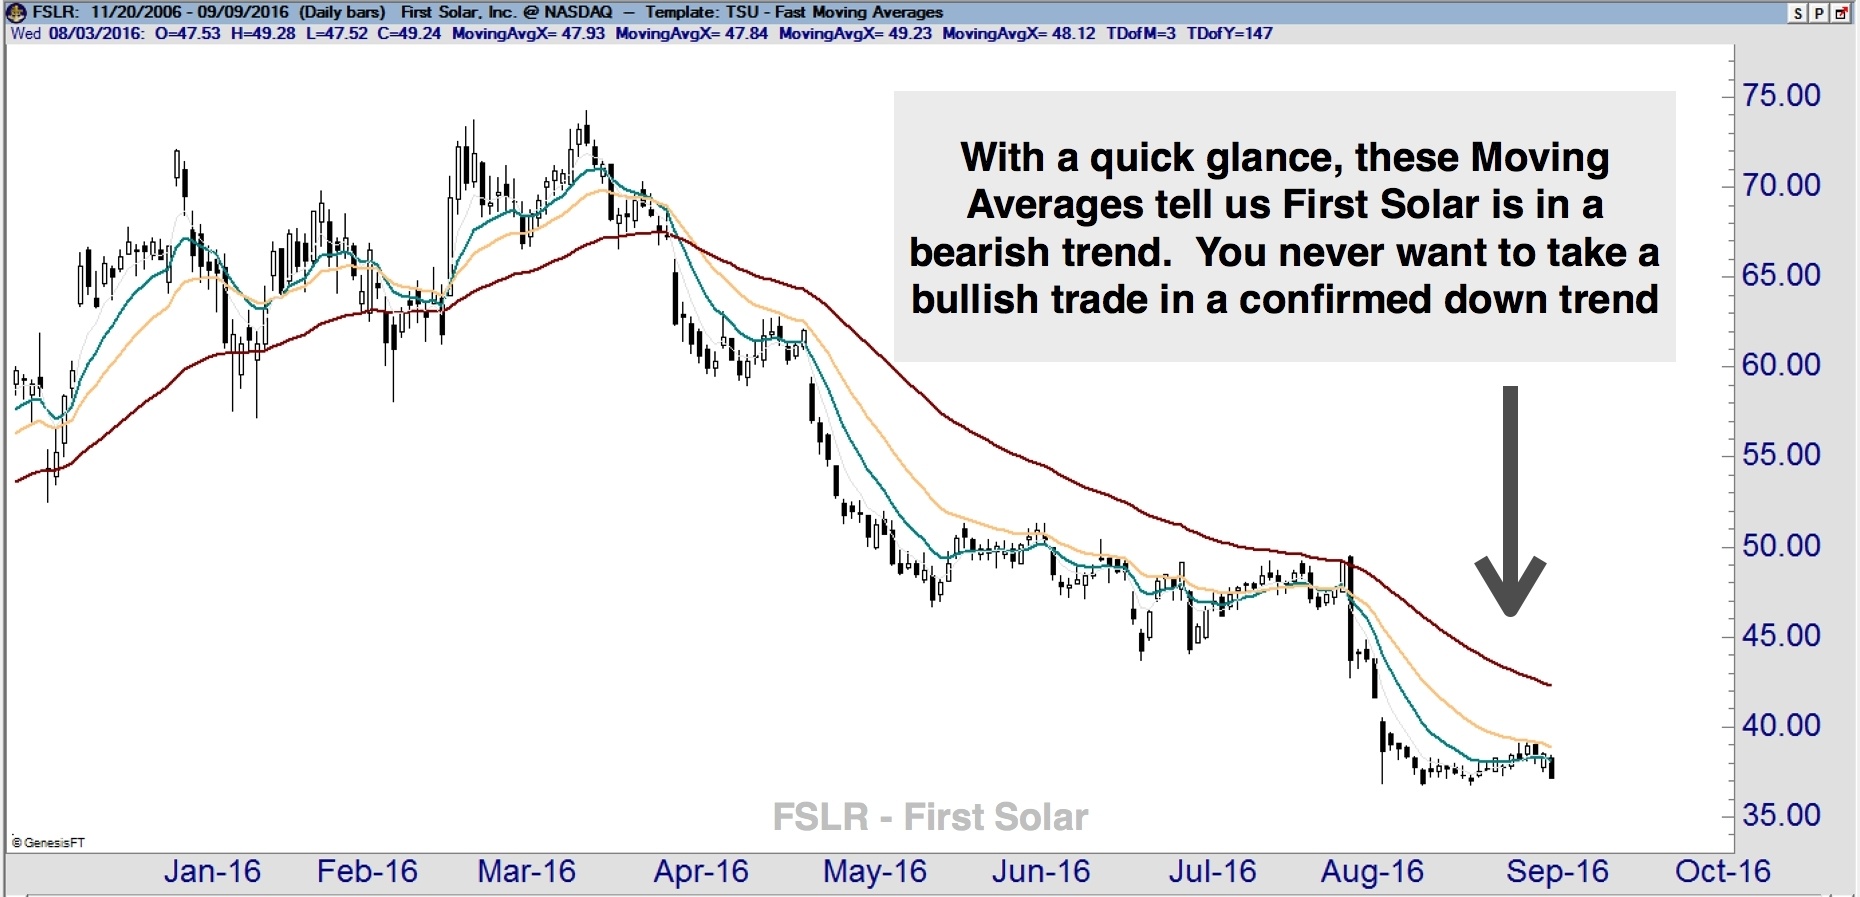
Once you look at the trend indicators, you can determine if you're trending up or down. If you're trending down, you should consider getting out of the trade and maybe taking a bearish trade instead. But if you've been trending down and the trend indicates it has changed, it may be an excellent time to consider a new position in that stock.
Every great trader knows how to stay very aware of the trend. When you learn to quickly identify the trend, which you can do in 1 minute or less, you agree with yourself to only trade in the direction of the trend.
Step 3: Identify Any Chart Patterns
The third step is to identify any relevant chart patterns. Chart patterns are little patterns of trading sentiment that appear on the chart. They can be an excellent tool for helping to identify the following action on the trade. For example, look at this double top pattern on Target (TGT).
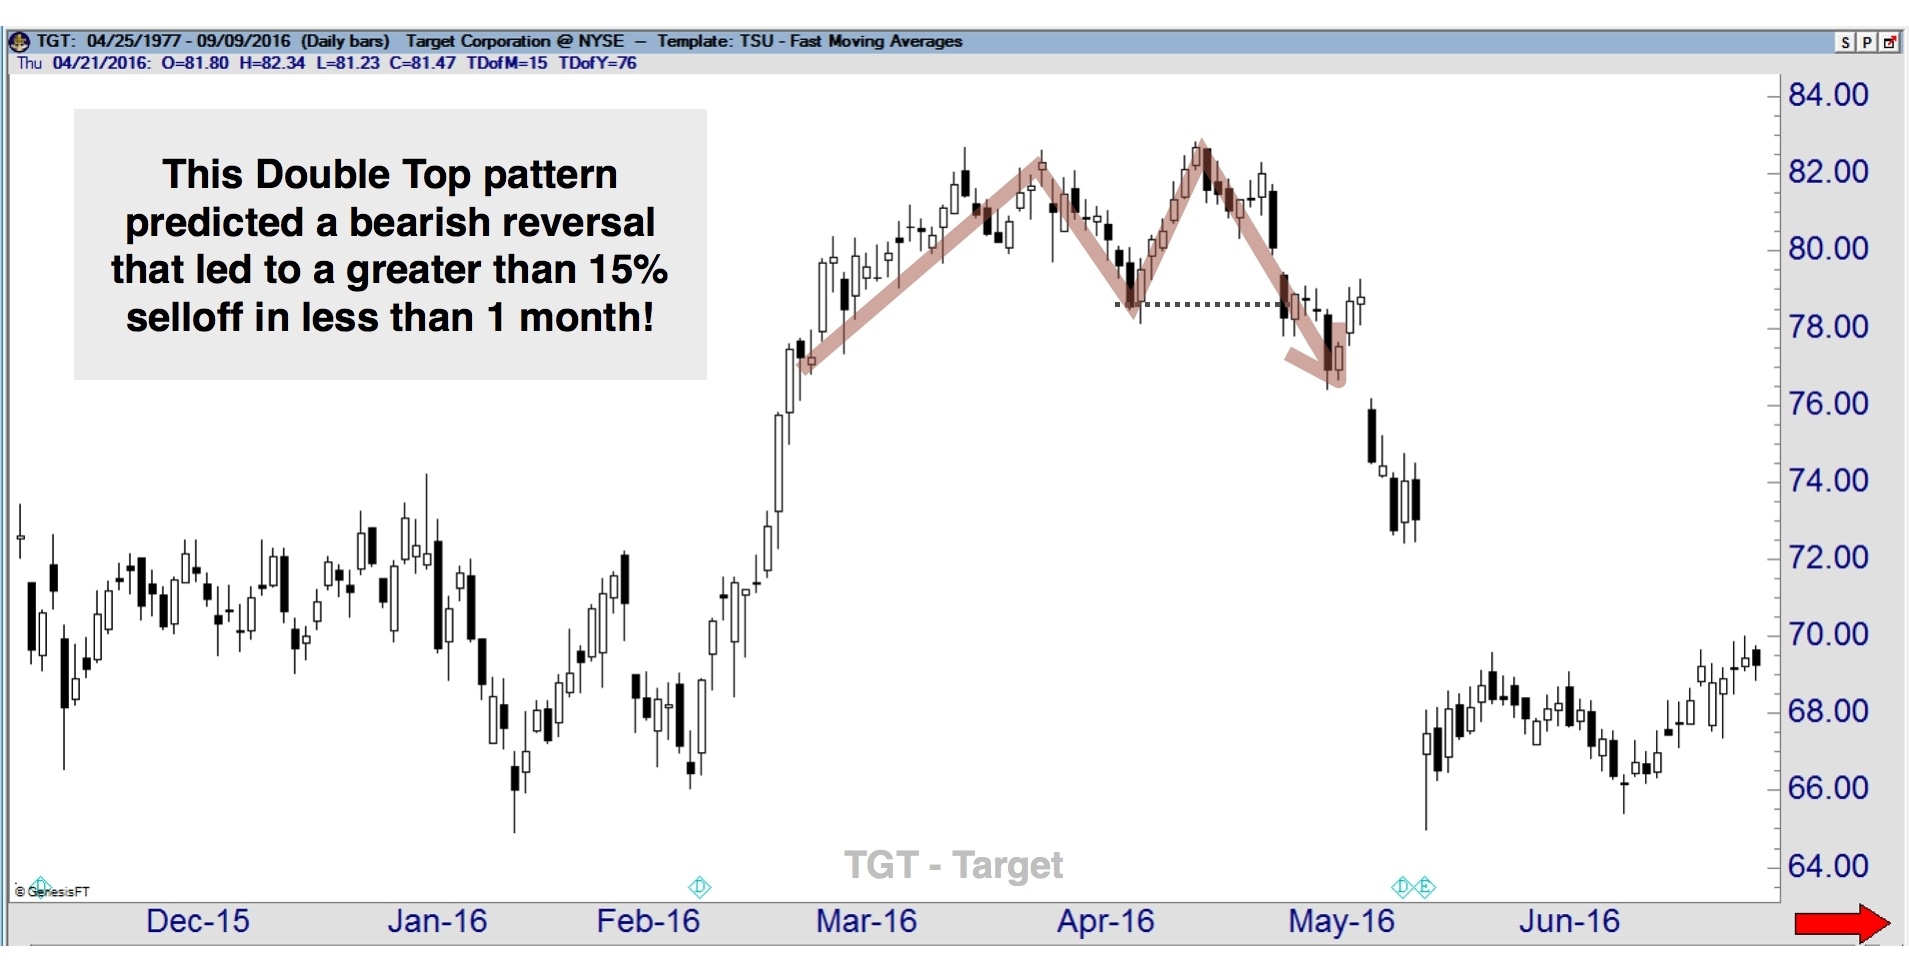
This pattern anticipated a market reversal. For traders who may have been long on this trade, this chart pattern may have been the only signal that warned the trade was about to collapse! Not all stocks are continually trading in a pattern at any given time. Still, when you can identify a pattern, it is an excellent addition to your analysis and will give you even more confidence in your trades.
Step 4: Identify Any Candlestick Patterns
The fourth step we use in our confirmation process is the analysis of Candlestick patterns. Candlestick trading has only been around in the U.S. for about 25 years. Still, in its homeland of Japan, Candlesticks have a remarkable history of helping people trade markets, which goes back to the 1600s!
Like chart patterns, candlestick patterns provide little snapshots of trader sentiment that help warn us about what the market is about to do. Unlike chart patterns, Candlestick patterns appear all the time. They provide excellent insight into the day-to-day sentiment shifts. Take, for example, this chart below:
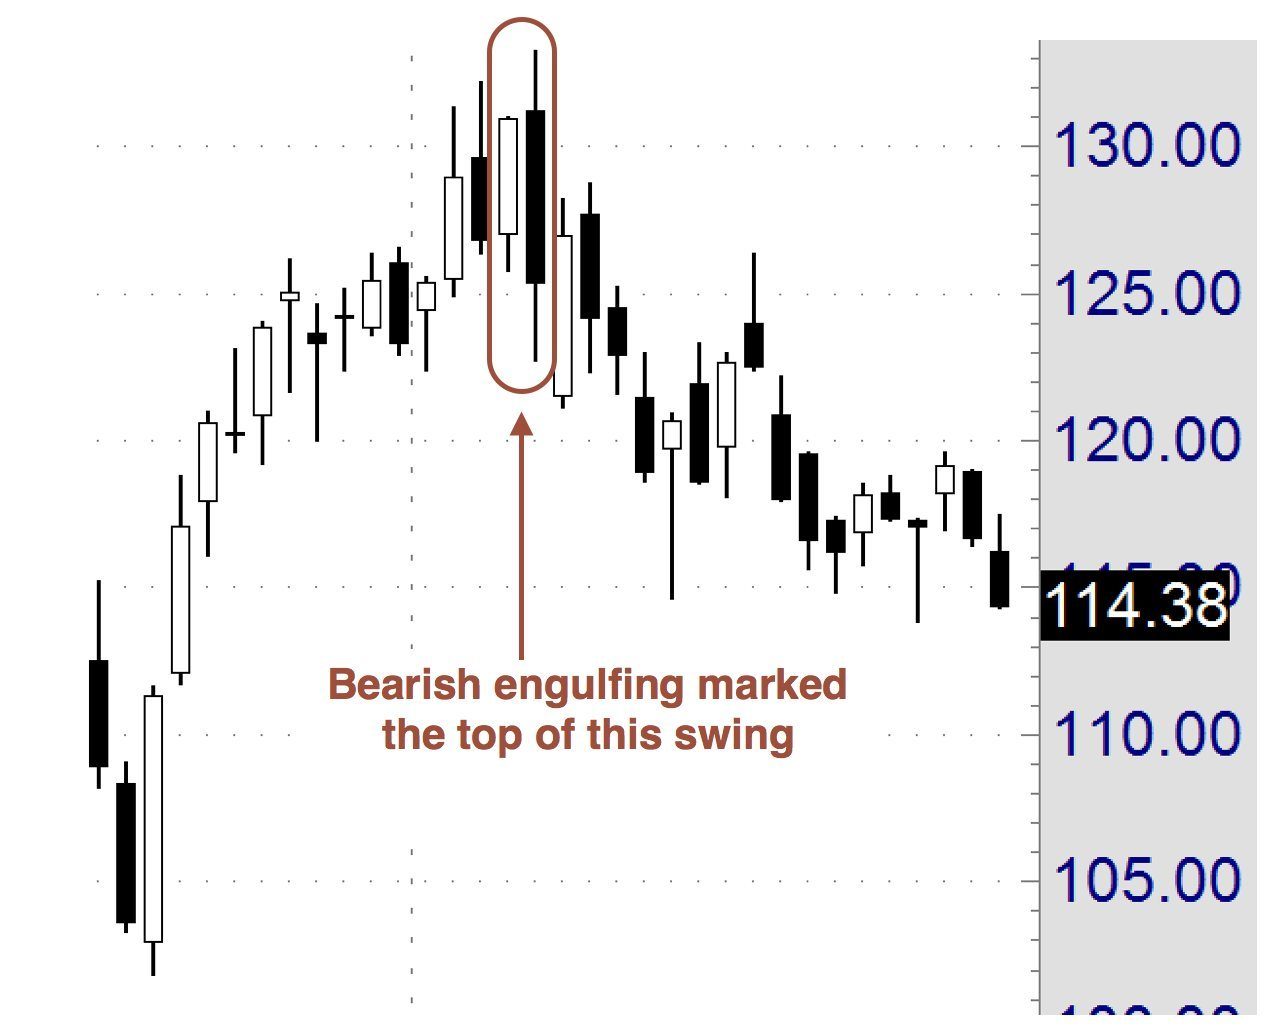
The highlighted candlestick pattern is a Bearish Engulfing pattern. This signals that a trend is likely to complete within two days and is about to reverse. In this example, the Bearish Engulfing pattern marked the top of the move, and the stock immediately reversed down over $15/share (more than 10%).
Candlestick trading is a comprehensive study unto itself. But it is a study worth taking the time to learn. People who have taken the time to learn candlesticks report later that they can not imagine trying to trade without them. They are a fantastic tool, one of the best leading indications, and an analysis tool that will give you much more confidence when you learn to trade with them.
Step 5: Check Your Indicators
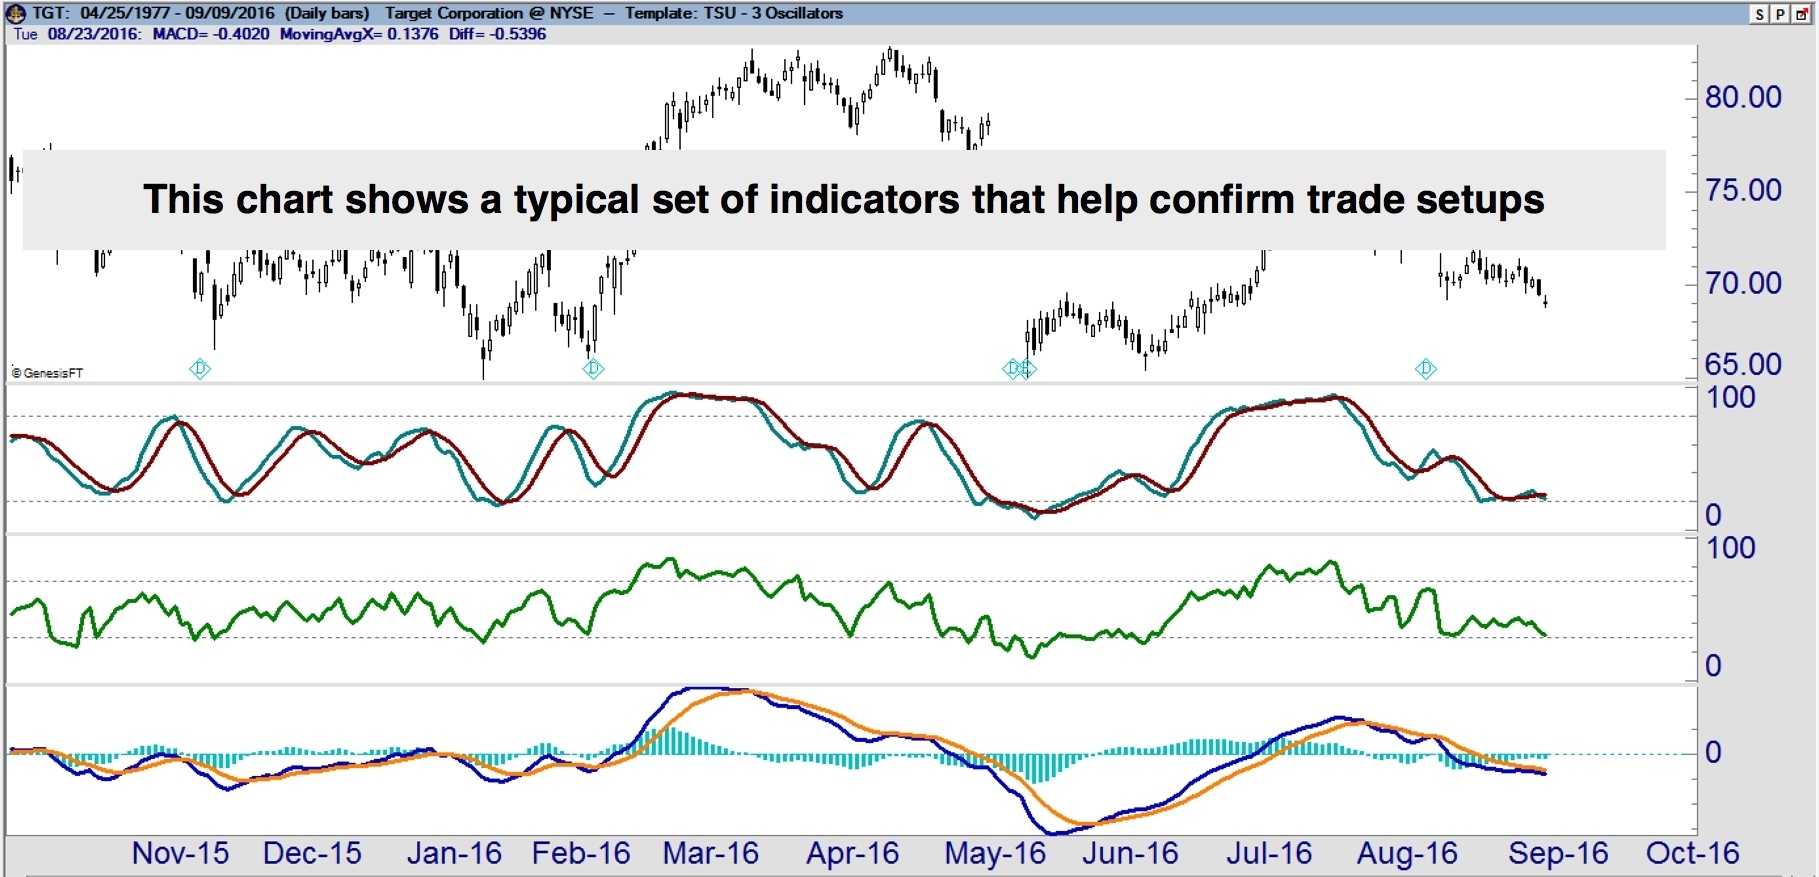
And finally, the last step is to look at your indicators. Indicators are a very misunderstood tool. A lot of people think indicators are magical; however, they are not. They believe there's a perfect indicator for every market, which there is not. Many people think that "if I could find that one indicator, then I could really be a great trader. Indicators Are a Tool That Have Only Two Functions:
- Confirm what we already know about a stock
- Alert us to something we didn't know
At TradeSmart, we teach a small handful of indicators and show you which market conditions each type of indicator applies to. This streamlines the process and gives you more confidence in your trades. The indicators we teach at Tradesmart University are:
- Moving Averages
- Stochastics
- RSI
- MACD
- Bollinger Bands
We also hit on a few additional indicators, but this is the core we teach through with almost every class. In reality, you do not need a lot of indicators. Just a handful gives you a simple set of trade indications to gain better optics on your trades.
In Closing
If you take this general outline and learn to apply it, you will be amazed to discover how much faster and more accurately you can anticipate future stock price movement, which will give you great confidence! For most people, the idea of trading the "random stock market" with confidence is a pipe dream. But professional traders who make consistent profits in the market trade with an identical or very similar process to the one outlined here.
