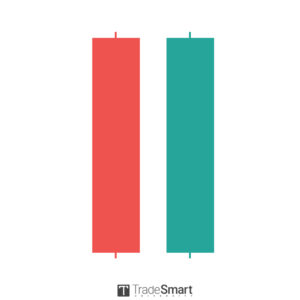
What is it?
The Tweezer Bottom candlestick pattern usually takes place over two time periods; however, it can be more than two. The main identify factor of this pattern is all the candles in the pattern have the same low price for the period. It can be either the opening price for the candle or the closing price but the low needs to be the same regardless of whether the candle is black (red) or white (green) in color. Also, individual candlestick size has only a minor impact on the signal this candlestick pattern provides, as we will explain below.

What should I do when I see this pattern?
The Tweezer Bottom candlestick pattern is typically a bullish reversal pattern when found at the bottom of a downswing. As we said in the first paragraph, the color and size of the candles are both minor factors when considering the bullish reversal signal of this pattern. However, they can lend to the credibility of the reversal if the 1st candle is black and the 2nd candle is white. Plus, if the candlestick bodies are the same size, we would give more validity to a bullish reversal outlook. As always, you should confirm that the price action of the next candle has moved higher before entering a reversal trade.

