Chart patterns are a great addition to every trader's toolbox. They help increase a trader's insight into trading sentiment and ultimately give indications as to the next likely move. Unlike some of the newer techniques and gimmicks in the world of trading, chart patterns are a time-tested trading technique that has proven to be a solid and reliable prediction tool.
Failure to Accurately Identify a Pattern
We saw a blog post a few years back from a company who teaches people how to trade the market. The writer was trying to make the point chart patterns are unreliable, and traders should use this company’s proprietary trading indicators instead.
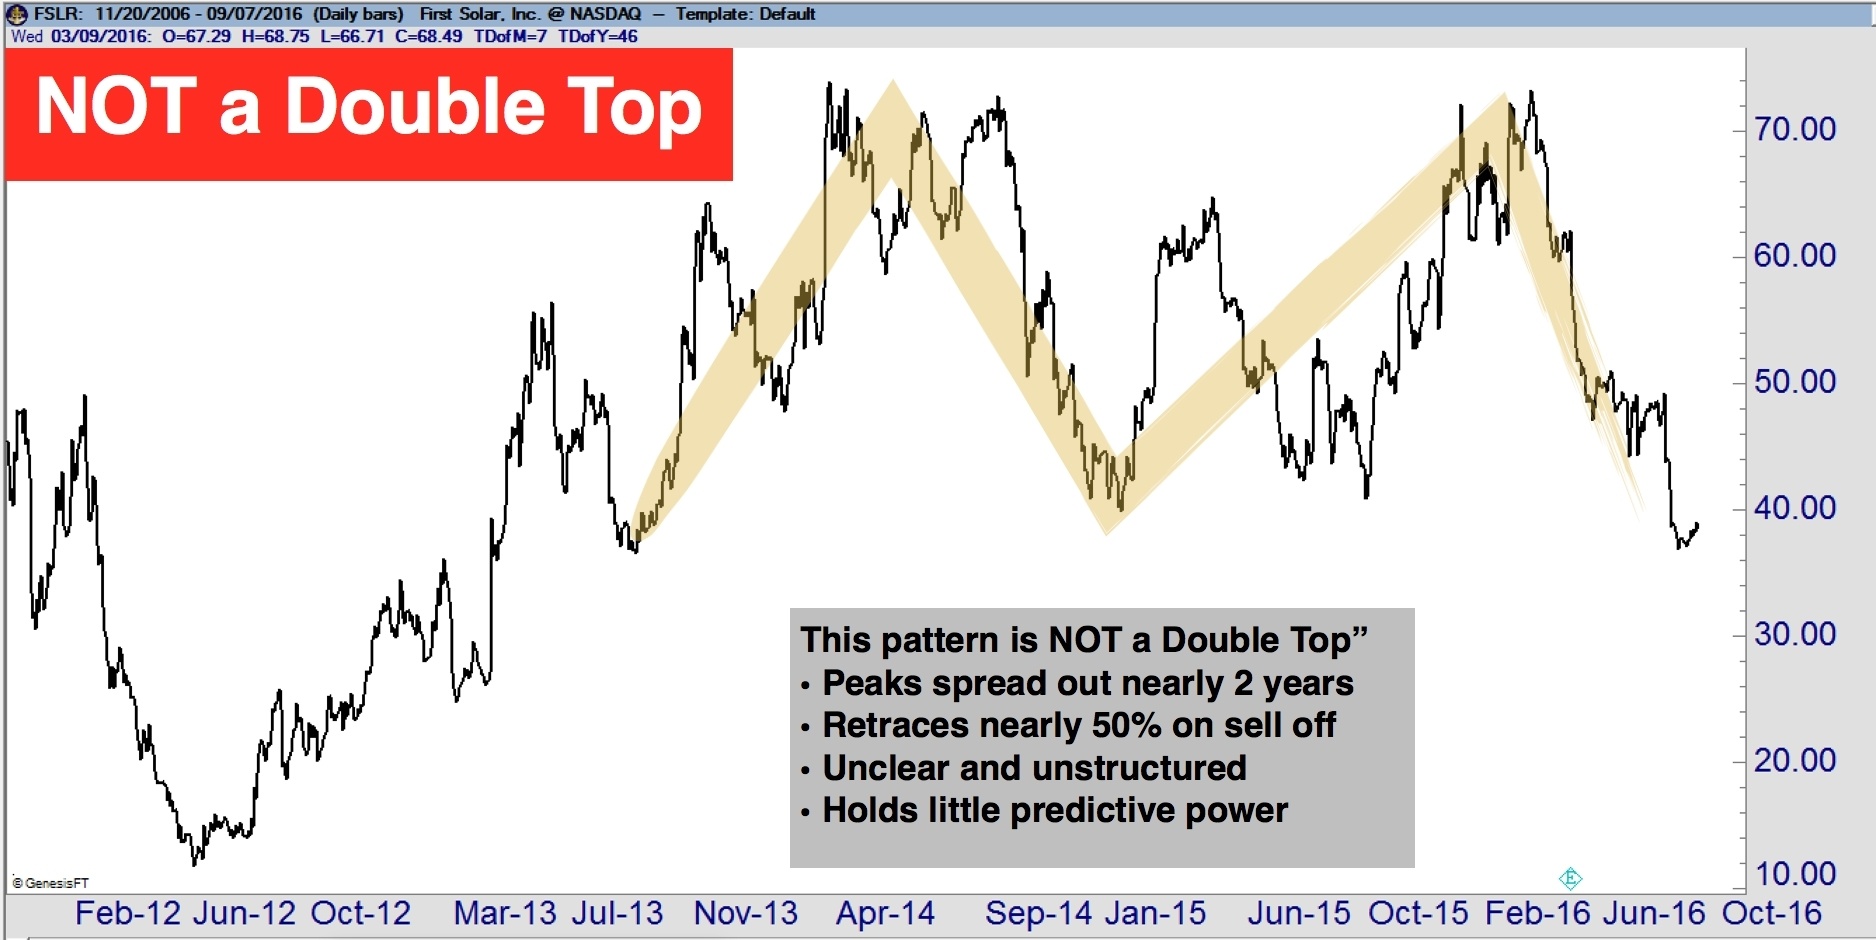
As his example to prove how unreliable chart patterns are, this blogger chose a stock that had made a new high, pulled back nearly 50% over three months, then traded back to the same high over another several months, and pulled back 50% again, only to trade higher.
His conclusion: Double tops are unreliable.

In this example, the blogger misses the point because he is trying to categorize a double top by saying “any time a stock hits the same resistance and pulls back it’s a double top,” which unfortunately is inaccurate information.
On a daily chart, a Double Top will rarely take more than 3-6 weeks to develop, and the retracement point is typically about 3-5%, maybe pushing down to a 10% retracement. Trying to contend that a pattern has taken over a year to develop, and the retracement represented a 50% is a poor interpretation of a Double Top.
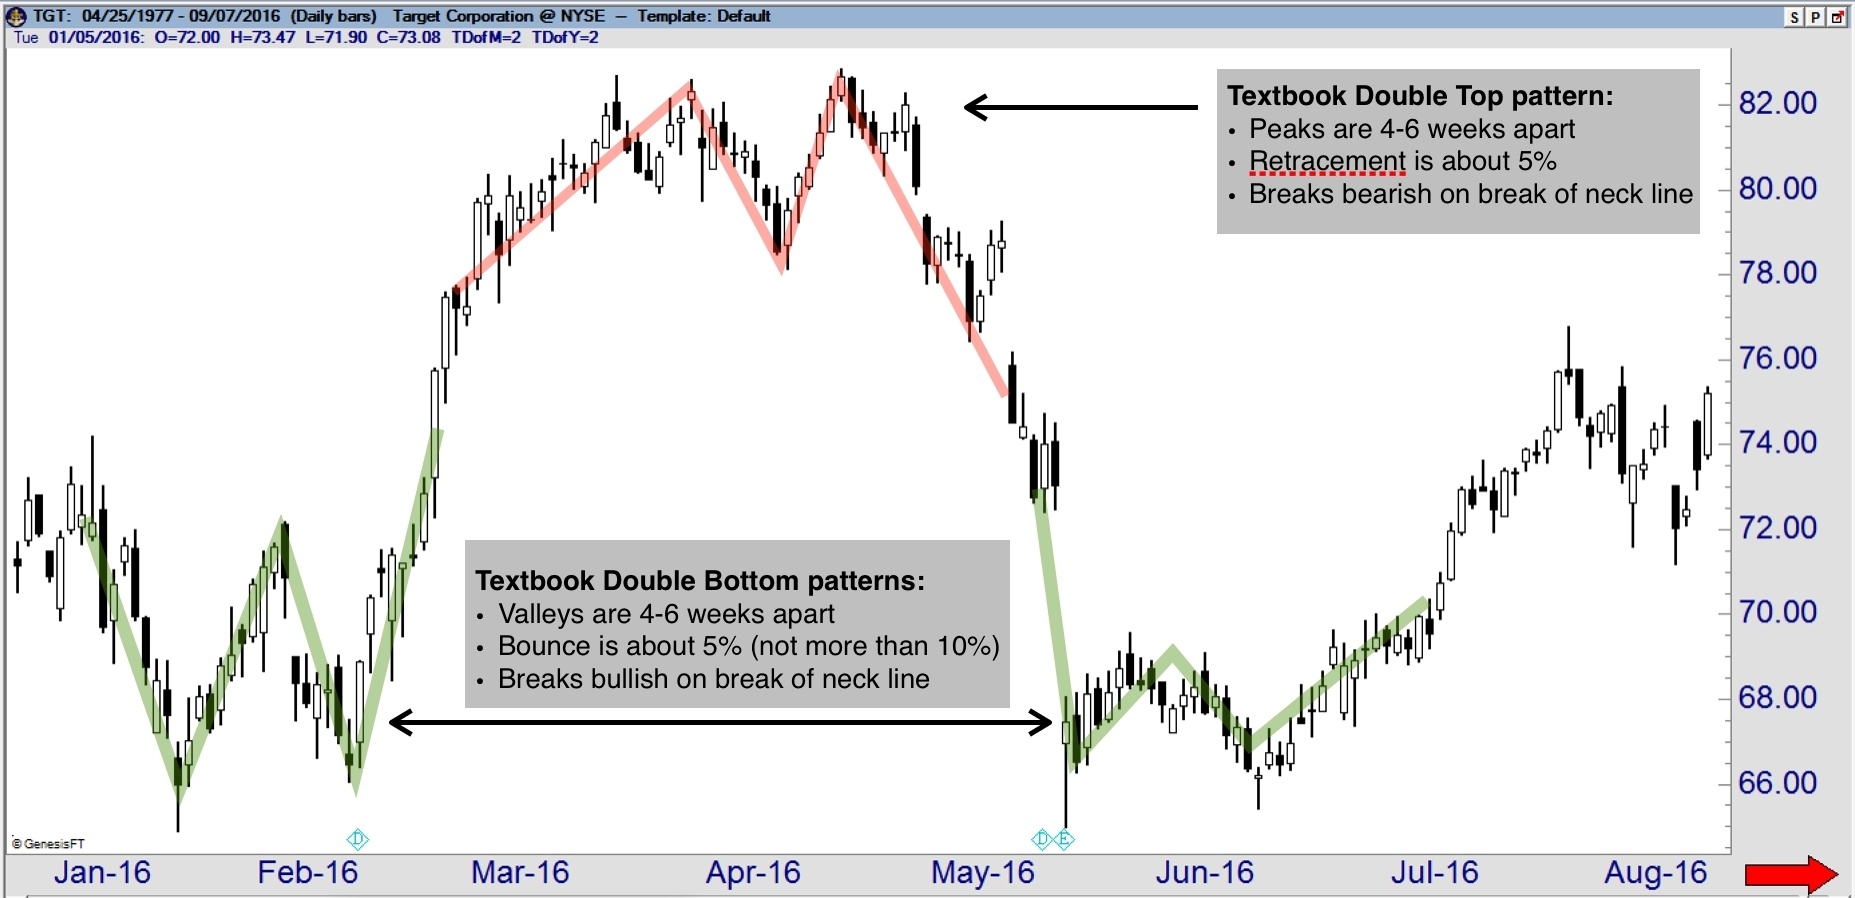
Below you can see what a real Double Top looks like. Additionally, this chart presented two real Double Bottoms as well. This is a textbook picture of what Double Tops and Bottoms should look like. Notice the peaks and the valleys are only about 4-6 weeks apart. The retracements are 3-5%, not exceeding 10%, and they trade exactly as expected on the break of the necklines or the confirmation point.

We do want to make one point on the details of the retracements. The general rule is 3-5%, not to exceed 10%. Does that mean that if a pattern appears and it represents an 11.5% retracement, but every other aspect fits the textbook definition of the Double Top that the pattern is void? No, not at all. It's a general guideline. Similarly, if the peaks or valleys are eight weeks apart, but everything else is perfect, it's probably just fine to call it a double top or bottom.
It does, however, mean our blogger friend who tried to say the previous example with a nearly 50% sell-off over a year - well he's just wrong. In general, 3-5% upwards of a 10% retracement is acceptable. If you get much beyond that, then you should be suspect. If you see a 15-20% retracement - it's probably not part of a Double Top.
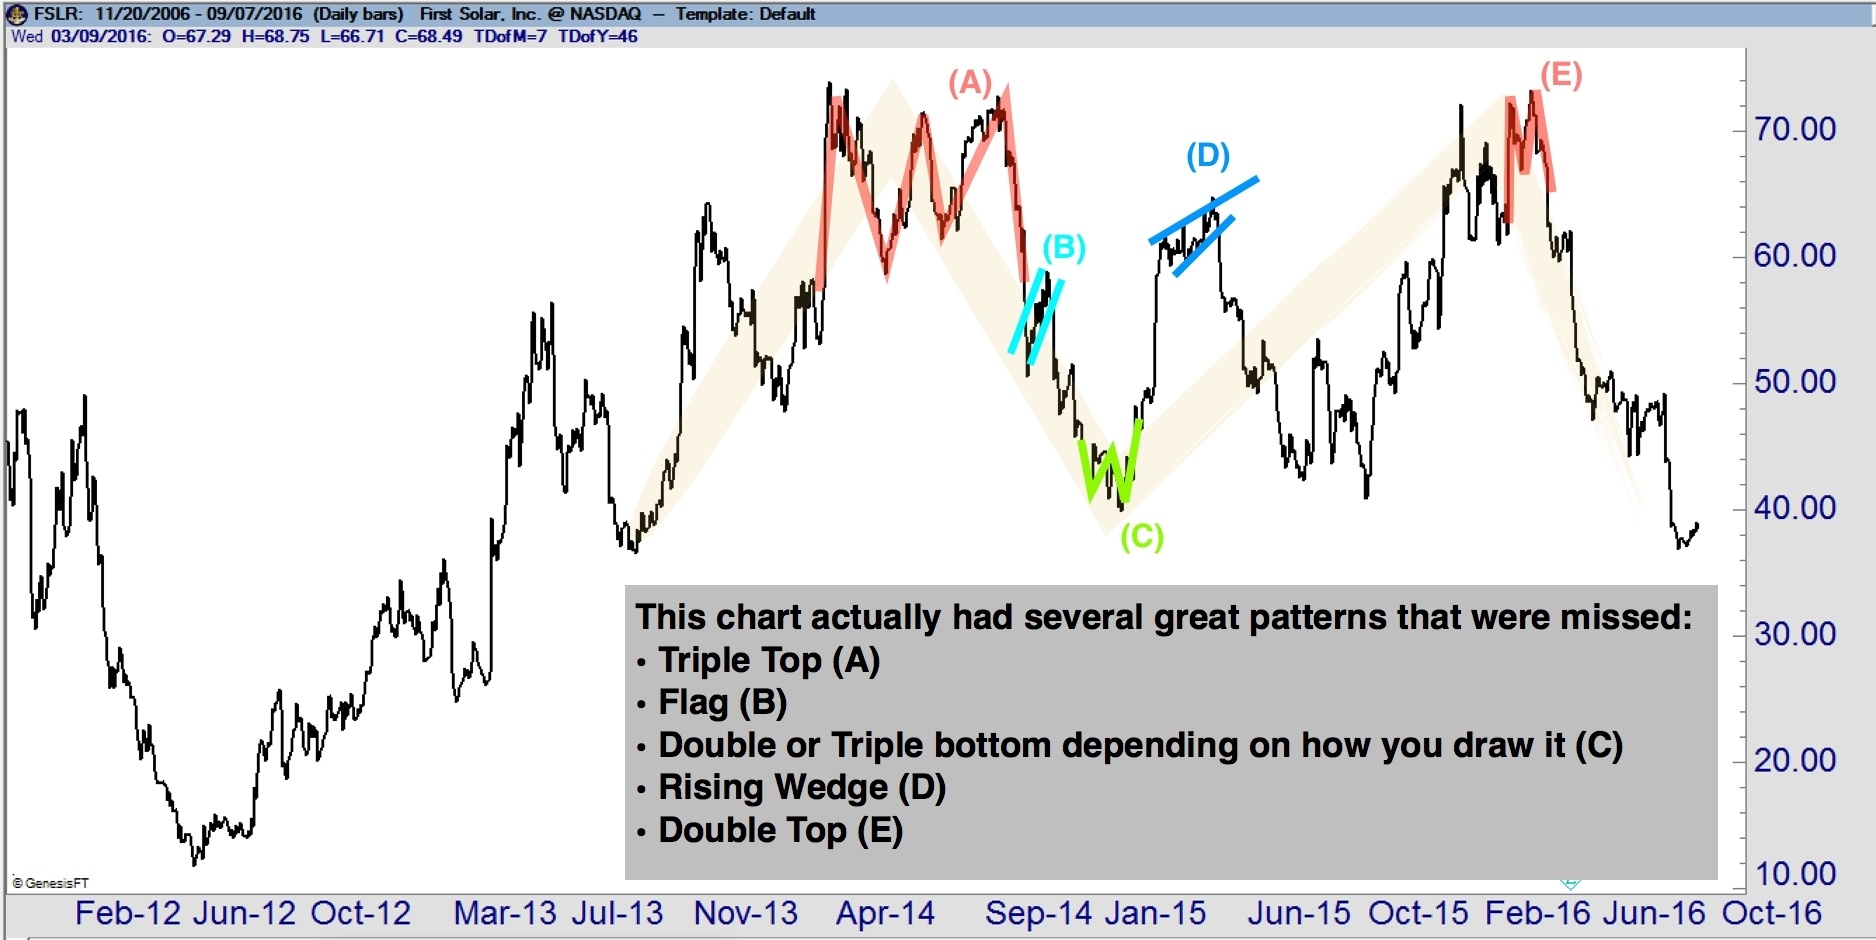
By the way, in the case of that blogger, had he accurately identified the patterns, they would have played out exactly as he expected as there were several great patterns in the chart. Below you can see the same chart accurately analyzed, and you can see at least five clear patterns, all of which played out according to their statistical odds.

Accurate identification of patterns is very important if we want to get the best insight from what they are telling us as traders.
At TradeSmart University, we categorize chart patterns in 3 broad categories:
- Consolidation patterns
- Continuation patterns
- Reversal patterns
Every pattern fits into one of these categories, and we have a fairly tight definition as to what we consider a pattern.
Additional resources:
• Thomas Bulkowski has made a career of selling chart pattern statistics. Although I do not always agree with his statistical research, his definitions are usually pretty good.
• The classic technical analysis book by Edwards and Magee, originally written in the 1930’s, has some of the best information on chart patterns and technical analysis in general. You can find an updated edition on Amazon.In closing, chart patterns are a great tool to help traders. But when definitions get blurred, the effectiveness of using chart patterns becomes very checkered. If you want to be great at trading with chart patterns, learn to correctly identify the patterns, so there is no confusion as to what it is you are looking at on the chart.
