Welcome back to another edition of A Trader's Journey, where we will cover the contents of Foundation of Trading level 3 class 2: indicators. The great thing about indicators is, they are simple to use, and they are an excellent way to confirm a trend, confirm entering a trade, or confirm an exit from a trade. But what exactly is an indicator, you ask? Let's dive into exactly what an indicator is and what it can signal to a trader.
What is an Indicator?
A technical analysis indicator is a mathematical calculation that signals support for entry and exit points of a trade. Indicators as a whole are typically only used as a minor factor for getting in and out of a trade; however, they are a strong supporting force when accompanying other candlestick chart data such as support and resistance lines. One of the most beneficial indicators is the exponential moving average.

Around TradeSmart, we tend to set three exponential moving average lines on our candlestick charts: the ten-day moving average, the twenty-day moving average, and the fifty-day moving average. The exponential moving average lines can confirm when a trend is happening. For example, if the price of a stock is below all three moving average lines, then the stock is dropping in price and trending bearish. If the price of a stock is above all three moving average lines, then the stock is rising in price and trending bullish. However, if the price of the stock is in or around the moving average lines, then the stock is trending sideways with no real trend to trade.
Checking to see where the stock falls in line with your EMAs is a great way to confirm a trend, but the primary philosophy behind using the exponential moving average comes into play when the lines of the EMA cross, as the crossing lines can be a strong signal to buy or sell. Again, you should avoid using exponential moving averages as your only signal to get into and out of trades, but you can use them as a great confirmation signal to enter and exit your trades
However, it is best to remember these tools offer support to your trading analysis, and you should stay away from making trading decisions based on indicators alone. Again, the main idea is to use an indicator on your stock chart like an oil, gas, or temperature gauge for a car. It should tell us if our car is fine or if something is going wrong by alerting us with a red flag or a blinking dashboard light. Thus, the data an indicator provides is akin to an early warning system. Usually, this scenario is what happens, but there are times an indicator will show data different from what the stock charts are doing. Times where the price of the stock is going up, but our indicator is going down. When these moments of opposition happen, they are known as divergence.

What is Divergence?
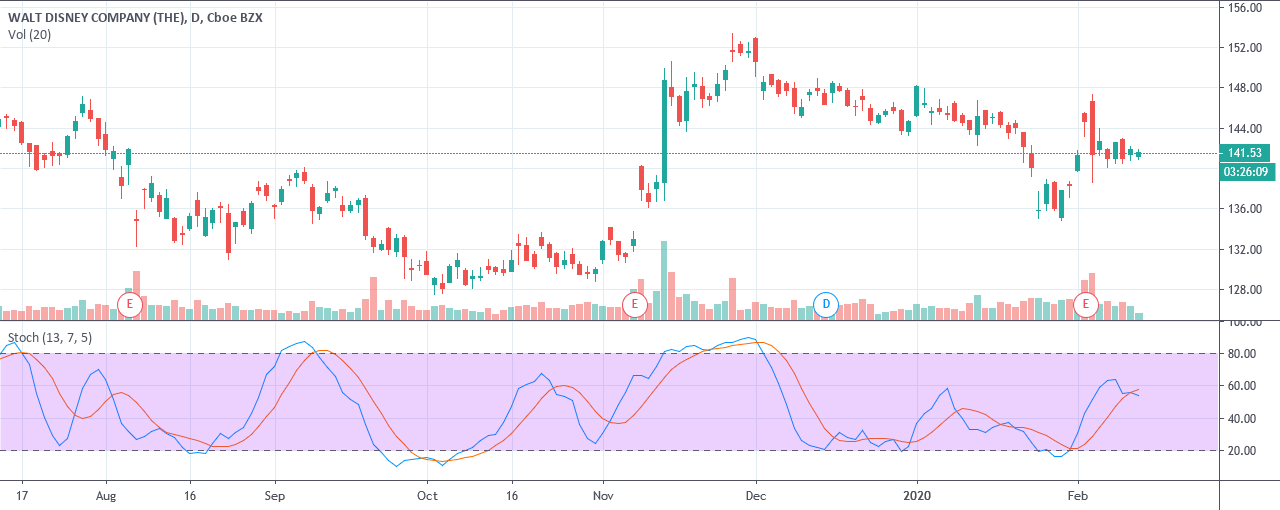
Divergence is when the peaks and valleys of the oscillator do not match the current price movement of the stock. When this discrepancy happens, it is a signal that there is an upcoming change in the marketplace. This shift in how the stock is viewed can happen over the course of a day, a week, or even a month or more as a time frame is not necessarily applied. But what it represents is a shift in the market's sentiment on how the stock is viewed, and this shift very often leads to a price reversal. Also, it should be noted that the larger the time frame over which the divergence occurs, the larger the size of the reversal which is likely to follow. There are two types of divergence to keep an eye out for bearish divergence and bullish divergence.

Bearish Divergence
A bearish divergence occurs when the peaks of a stock differ from the peaks of the oscillator.
Bullish Divergence
A bullish divergence occurs when the valleys of the stock differ from the valleys of the oscillator.
In closing, just as a dashboard in your car provides timely information to the driver, indicators are a great way to supplement the data on your stock charts. And as with all indicators, the signals they provide are only indicators of possible market action. It is good to use them, and when the signals discussed in this blog occur, you should be particularly aware of a possible upcoming price reversal. However, using them for detailed trade entries and exits should be avoided.
As always, if you wish to review our previous blogs covering the Foundations of Trading classes, please click on the Foundations of Trading blog category on the right-hand side of the page. That will instantly bring up all the blogs from this series for you. That's all for today, and we hope to see you next week!