In our first Indicator blog we introduced you to what indicators are and looked at the exponential moving average, and you can read our opening blog here. Today, we are going to take a closer look at indicators as they are presented in Foundations of Stocks and Options Level 1 Class 5. We will cover the simple moving average and take a deeper dive on the exponential moving average and how that information can be utilized in your day to day trading.
The Simple Moving Average
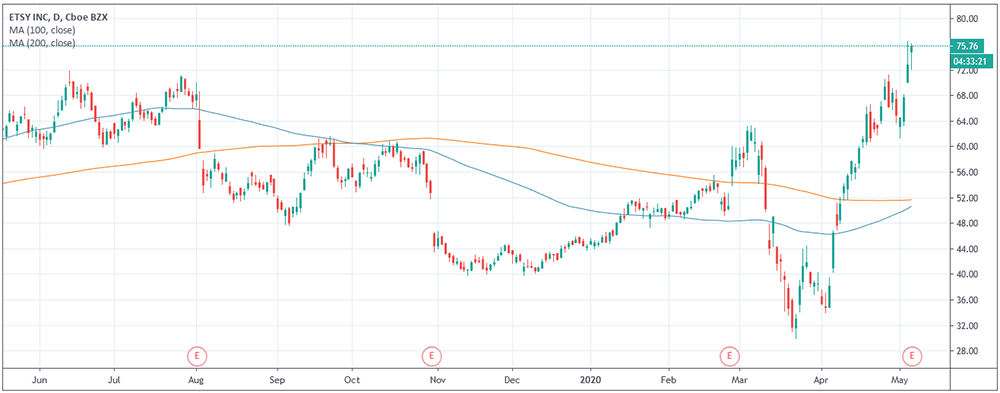
The simple moving average is a calculation of the closing price over a specified time period. You can use the simple moving average for any time period; however, around Tradesmart, we tend to use it for identifying long term trends. Our settings for the simple moving average use the 100 period SMA and the 200 period SMA at the same time. Using these two simple moving averages is an excellent way to smooth out the day to day volatility of the market and view a stock’s progress through a long-term lens. This viewpoint benefits a stock investor more so than the short-term trader. Below is a screen grab of Etsy with the 100 and 200 SMAs included.

The Exponential Moving Average
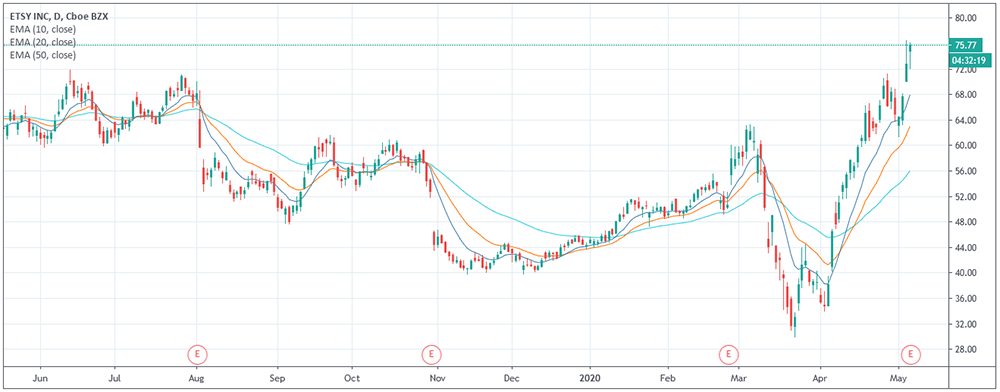
Similar to the simple moving average, the exponential moving average is a calculation of the closing price over a specified time period; but the exponential moving average has a heavier weighting on the more recent days. You can use the exponential moving average for any time period, though we tend to use it for identifying short term trends. Our settings for the exponential moving average use the 10 period EMA, the 20 period EMA, and the 50 EMA at the same time. When using all three of these averages together, it can offer a couple of excellent benefits to the active stock trader. Below is a screen grab of Etsy with the 10, 20, and 50 EMAs included.

The Benefits of Exponential Moving Averages
There are three main benefits of using the exponential moving averages: they can provide trend direction, entry triggers, and even offer support and resistance lines for your current trade.
Trend Direction
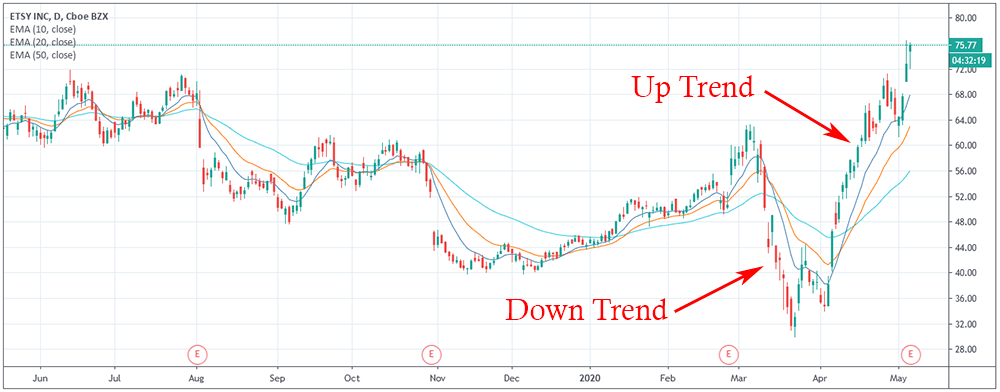
Identifying trend direction is by far the most common usage of the exponential moving averages. In most cases, if the price action of a stock is above the EMAs, then the stock is moving in a bullish direction or an uptrend. Conversely, if the price action of a stock is below the EMAs, then the stock is moving in a bearish direction or a downtrend. Finally, if the price action of a stock is through the EMAs, then the stock is in a sideways trend, which makes it challenging to analyze and actively trade. Below is a screen grab of Etsy with an uptrend and downtrend marked.

Entry Trigger
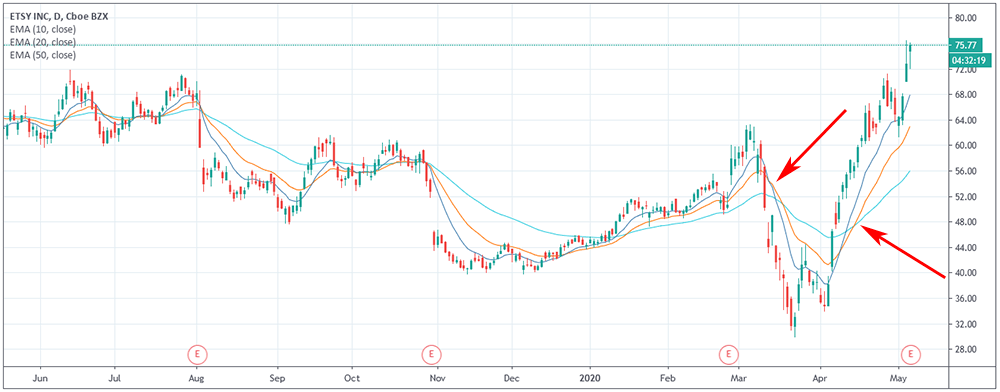
The second benefit of using the three listed EMAs is they can identify optimum points where you can buy or sell a stock. This buy or sell signal is known as the Moving Average Cross and takes place when two or more of the moving averages on your candlestick chart cross over each other. These cross points are a strong signal of a new trend. Below is a screen grab of Etsy with two Moving Average Crosses marked. The red arrow on the left signals the start of a downtrend while the red arrow in the right signals an uptrend.

Support and Resistance
Finally, moving averages lines can double up as support and resistance lines. If a stock’s price action is above the moving averages, then it is support. If a stock’s price action is below the moving averages, this will function as resistance. Usually, the twenty-period exponential moving averages is one of the best to use in this way.
In closing, it is good always to remember moving averages function best when identifying the upward or downward trend of a stock. And even better to remember from making trading decisions using moving averages when a stock is in a sideways channel. Even with the sideways channel limitations, moving averages provide a valuable component to the trader’s toolkit.
