Welcome back to another edition of A Trader's Journey, where we will cover the contents of Foundation of Trading level 3 class 4. In this class, we will build upon what we learned last week with the Fibonacci Sequence and learn how to identify 'waves' on your candlestick chart. So, grab your metaphorical surfboard, and let's hit the virtual beach.
Types of Waves
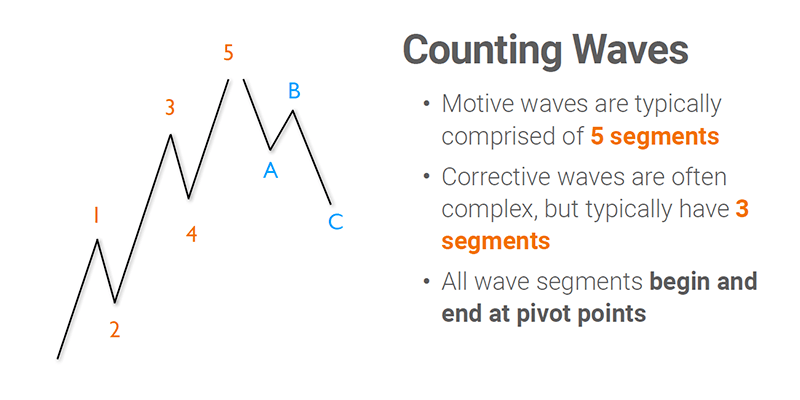
There are two types of waves you can find on your candlestick chart: motive and corrective. A motive wave pattern is a large bullish trend wave pattern that is made up of five smaller waves or segments. The smaller segments usually follow the direction of the overall trend and can be viewed as making progress towards a final price high point. On the flip side, a corrective wave is a direct counter to the motive wave as the stock drops in price or retraces some of its gains. A corrective wave is usually made up of three smaller segments.

Counting Motive Waves
Again, motive waves are typically comprised of five segments, while corrective waves, which are often more complex in nature, but typically have three segments. However, the segments of both waves always begin and end at pivot points on your stock chart.
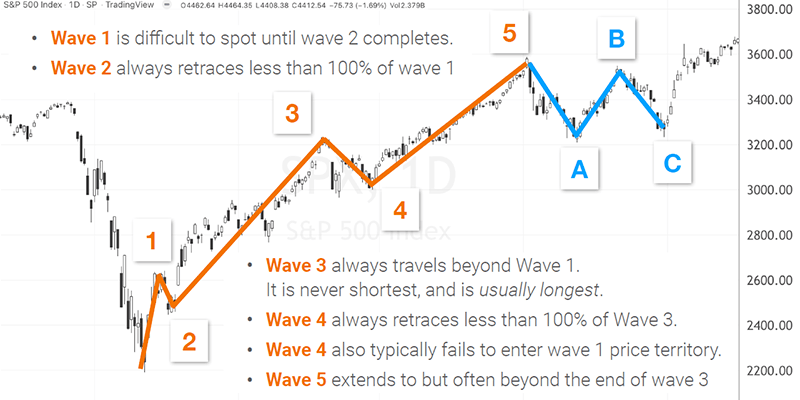
When tracking or counting the motive waves segments, it is good to remember a few key points. Wave one is difficult to determine until wave two completes its crest. Wave two always retraces less than one hundred percent of wave one. While wave three always travels beyond the highest point of wave one to a new higher high, plus wave three is never the shortest segment as it is usually the longest of the five segments. Then as with wave two, wave four will retrace, but it always retraces less than one hundred percent of the previous wave or wave three.

Even though wave four does some retracement, it typically fails to enter wave one's original price territory. Finally, wave five extends to a higher high, which is often beyond the high price point of wave three. Granted, there are a few guardrails to counting motive waves, but remember that overall, the trend of a motive wave will make bullish progress.
Counting Corrective Waves
Counting corrective waves takes a little more practice, as many fortunes have been lost trying to predict corrective waves. It can be difficult to fit corrective waves into a pattern before they are completed. So please exercise patience in your analysis while a stock is going through its corrective phases.
Wave Characteristics
Here are a few key points to always consider when analyzing a motive wave. Wave one is always part of a consolidation process. Wave two is often low volume and volatility. Wave three is usually strong and broad with good volume. While wave four will often trend sideways, and finally, wave five is usually a strong but less dramatic price push than wave three.
Here are a few keys points to keep in mind when analyzing a corrective wave. A trader may confuse wave A with a minor pullback in the stock price instead of being the beginning of a corrective wave pattern. Wave B is where Bear/Bull traps to be doomed by wave C, and finally, wave C is a typical "3rd" wave with similar traits to other third waves found in the wave patterns.
In Closing
Waves often have a correlation with the golden ratio or the Fibonacci Sequence, so a good knowledge of Waves and Fibs can accurately help a trader forecast retracements and extensions of a stock's price. Once these patterns start forming, you can measure them to help predict the tops and bottoms of the upcoming waves or segments. All in all, another excellent tool that you can place in your trader toolkit to help you trade smarter with your capital and reduce your chances of financial loss. That's it for today's post, and check back with us next week for an overview of the final class of the Foundations of Trading. Thank you for reading!
